Thursday, 3 October 2013

Improved App Insight by Linking Google Analytics with Google Play

Posted by Ellie Powers, Google Play team


A key part of growing your app’s installed base is knowing more about your users — how they discover your app, what devices they use, what they do when they use your app, and how often they return to it. Understanding your users is now made easier through a new integration between Google Analytics and the Google Play Developer Console.


Starting today, you can link your Google Analytics account with your Google Play Developer Console to get powerful new insights into your app’s user acquisition and engagement. In Google Analytics, you’ll get a new report highlighting which campaigns are driving the most views, installs, and new users in Google Play. In the Developer Console, you’ll get new app stats that let you easily see your app’s engagement based on Analytics data.


This combined data can help you take your app business to the next level, especially if you’re using multiple campaigns or monetizing through advertisements and in-app products that depend on high engagement. Linking Google Analytics to your Developer Console is straightforward — the sections below explain the new types of data you can get and how to get started.


In Google Analytics, see your app’s Google Play referral flow


Once you’ve linked your Analytics account to your Developer Console, you’ll see a new report in Google Analytics called Google Play Referral Flow. This report details each of your campaigns and the user traffic that they drive. For each campaign, you can see how many users viewed listing page in Google Play and how many went on to install your app and ultimately launch it on their mobile devices.


With this data you can track the effectiveness of a wide range of campaigns — such as blogs, news articles, and ad campaigns — and get insight into which marketing activities are most effective for your business. You can find the Google Play report by going to Google Analytics and clicking on Acquisitions > Google Play > Referral Flow.


In the Developer Console, see engagement data from Google Analytics


If you’re already using Google Analytics, you know how important it is to see how users are interacting with your app. How often do they launch it? How much do they do with it? What are they doing inside the app?


Once you link your Analytics account, you’ll be able to see your app’s engagement data from Google Analytics right in the Statistics page in your Developer Console. You’ll be able to select two new metrics from the drop-down menu at the top of the page:


  • Active users: the number of users who have launched your app that day

  • New users: the number of users who have launched your app for the first time that day


These engagement metrics are integrated with your other app statistics, so you can analyze them further across other dimensions, such as by country, language, device, Android version, app version, and carrier.


How to get started


To get started, you first need to integrate Google Analytics into your app. If you haven’t done this already, download the Google Analytics SDK for Android and then take a look at the developer documentation to learn how to add Analytics to your app. Once you’ve integrated Analytics into your app, upload the app to the Developer Console.


Next, you’ll need to link your Developer Console to Google Analytics. To do this, go to the Developer Console and select the app. At the bottom of the Statistics page, you’ll see directions about how to complete the linking. The process takes just a few moments.


That’s it! You can now see both the Google Play Referral Flow report in Google Analytics and the new engagement metrics in the Developer Console.


Thursday, 26 September 2013

Using the Hardware Scaler for Performance and Efficiency

Posted by Hak Matsuda and Dirk Dougherty, Android Developer Relations team


If you develop a performance-intensive 3D game, you’re always looking for ways to give users richer graphics, higher frame rates, and better responsiveness. You also want to conserve the user’s battery and keep the device from getting too warm during play. To help you optimize in all of these areas, consider taking advantage of the hardware scaler that’s available on almost all Android devices in the market today.


How it works and why you should use it


Virtually all modern Android devices use a CPU/GPU chipset that includes a hardware video scaler. Android provides the higher-level integration and makes the scaler available to apps through standard Android APIs, from Java or native (C++) code. To take advantage of the hardware scaler, all you have to do is render to a fixed-size graphics buffer, rather than using the system-provided default buffers, which are sized to the device's full screen resolution.


When you render to a fixed-size buffer, the device hardware does the work of scaling your scene up (or down) to match the device's screen resolution, including making any adjustments to aspect ratio. Typically, you would create a fixed-size buffer that's smaller than the device's full screen resolution, which lets you render more efficiently — especially on today's high-resolution screens.


Using the hardware scaler is more efficient for several reasons. First, hardware scalers are extremely fast and can produce great visual results through multi-tap and other algorithms that reduce artifacts. Second, because your app is rendering to a smaller buffer, the computation load on the GPU is reduced and performance improves. Third, with less computation work to do, the GPU runs cooler and uses less battery. And finally, you can choose what size rendering buffer you want to use, and that buffer can be the same on all devices, regardless of the actual screen resolution.


Optimizing the fill rate


In a mobile GPU, the pixel fill rate is one of the major sources of performance bottlenecks for performance game applications. With newer phones and tablets offering higher and higher screen resolutions, rendering your 2D or 3D graphics on those those devices can significantly reduce your frame rate. The GPU hits its maximum fill rate, and with so many pixels to fill, your frame rate drops.


style="border-radius: 6px;padding:0;margin:0;" />
Power consumed in the GPU at different rendering resolutions, across several popular chipsets in use on Android devices. (Data provided by Qualcomm).


To avoid these bottlenecks, you need to reduce the number of pixels that your game is drawing in each frame. There are several techniques for achieving that, such as using depth-prepass optimizations and others, but a really simple and effective way is making use of the hardware scaler.


Instead of rendering to a full-size buffer that could be as large as 2560x1600, your game can instead render to a smaller buffer — for example 1280x720 or 1920x1080 — and let the hardware scaler expand your scene without any additional cost and minimal loss in visual quality.


Reducing power consumption and thermal effects


A performance-intensive game can tend to consume too much battery and generate too much heat. The game’s power consumption and thermal conditions are important to users, and they are important considerations to developers as well.


As shown in the diagram, the power consumed in the device GPU increases significantly as rendering resolution rises. In most cases, any heavy use of power in GPU will end up reducing battery life in the device.


In addition, as CPU/GPU rendering load increases, heat is generated that can make the device uncomfortable to hold. The heat can even trigger CPU/GPU speed adjustments designed to cool the CPU/GPU, and these in turn can throttle the processing power that’s available to your game.


For both minimizing power consumption and thermal effects, using the hardware scaler can be very useful. Because you are rendering to a smaller buffer, the GPU spends less energy rendering and generates less heat.


Accessing the hardware scaler from Android APIs


Android gives you easy access to the hardware scaler through standard APIs, available from your Java code or from your native (C++) code through the Android NDK.


All you need to do is use the APIs to create a fixed-size buffer and render into it. You don’t need to consider the actual size of the device screen, however in cases where you want to preserve the original aspect ratio, you can either match the aspect ratio of the buffer to that of the screen, or you can adjust your rendering into the buffer.


From your Java code, you access the scaler through SurfaceView, introduced in API level 1. Here’s how you would create a fixed-size buffer at 1280x720 resolution:


surfaceView = new GLSurfaceView(this);
surfaceView.getHolder().setFixedSize(1280, 720);


If you want to use the scaler from native code, you can do so through the NativeActivity class, introduced in Android 2.3 (API level 9). Here’s how you would create a fixed-size buffer at 1280x720 resolution using NativeActivity:


int32_t ret = ANativeWindow_setBuffersGeometry(window, 1280, 720, 0);


By specifying a size for the buffer, the hardware scaler is enabled and you benefit in your rendering to the specified window.


Choosing a size for your graphics buffer


If you will use a fixed-size graphics buffer, it's important to choose a size that balances visual quality across targeted devices with performance and efficiency gains.


For most performance 3D games that use the hardware scaler, the recommended size for rendering is 1080p. As illustrated in the diagram, 1080p is a sweet spot that balances a visual quality, frame rate, and power consumption. If you are satisfied with 720p, of course you can use that size for even more efficient operations.


More information


If you’d like to take advantage of the hardware scaler in your app, take a look at the class documentation for SurfaceView or NativeActivity, depending on whether you are rendering through the Android framework or native APIs.

Watch for sample code on using the hardware scaler coming soon!

Wednesday, 18 September 2013

RenderScript in the Android Support Library


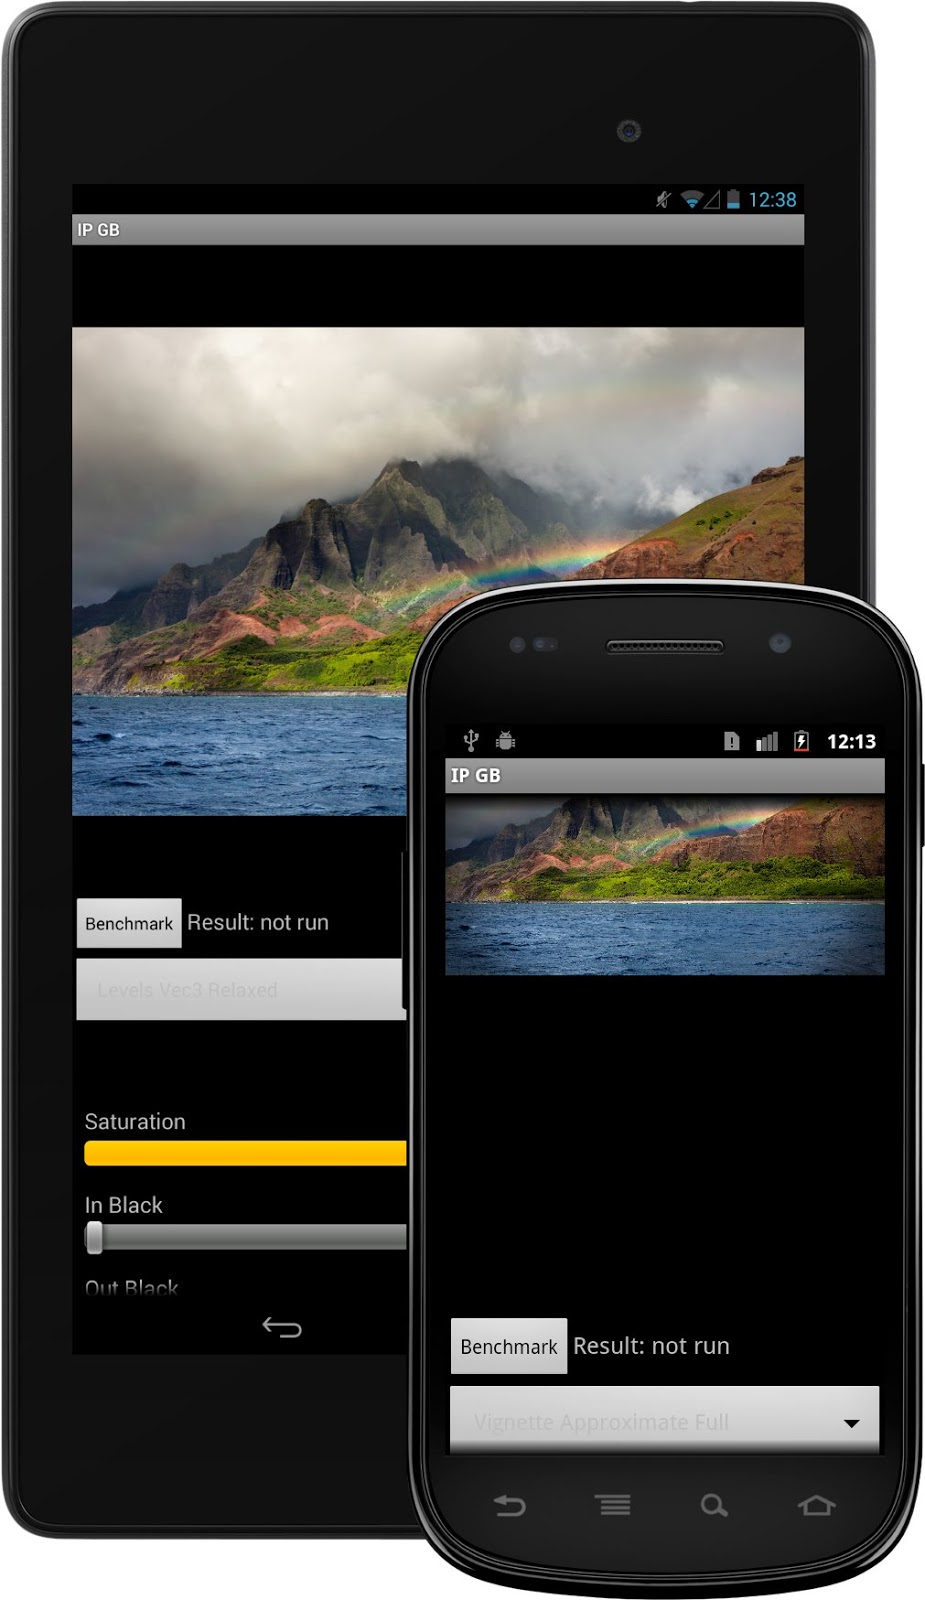
Renderscript Support library on devicesstyle="border-radius: 6px;padding:0;margin:0;" />

The RenderScript Support Library lets you take advantage of the latest RenderScript features on devices running Android 2.2 and later.


Posted by Tim Murray, Android RenderScript team

One of the requests we hear most commonly from developers is to enable more devices to run the latest features of RenderScript. Over the past several releases of Android, we’ve added a ton of functionality to the RenderScript runtime, but the runtime's dependence on the core Android platform version has limited the range of devices that can support that new functionality. We’ve been working on a solution to this since last year, and we’re now ready to share it with all Android developers.


Today we're announcing a new RenderScript Support Library and updated SDK tools that together let you take advantage of RenderScript on plaform versions all the way back to Android 2.2 (Froyo).

With ADT v22.2, SDK Tools v22.2, and Android Build Tools v18.1.0, apps targeting Android 2.2 and later can now make use of almost all of the functionality available natively in RenderScript with Android 4.3. This includes access to the newest RenderScript features such as high-performance intrinsics and the new performance optimizations available to scripts.


Using the RenderScript Support Library


Using the RenderScript Support Library is straightforward. Once you've updated ADT and your SDK tools, there are only two things that you have to do to start using Renderscript in your apps:


  1. In your classes that use RenderScript, import the RenderScript Support Library from android.support.v8.renderscript. If you are already using native RenderScript, you can change your import from android.renderscript to android.support.v8.renderscript.

    import android.support.v8.renderscript.*;


  2. In your project.properties, make sure you’re targeting android-18 and add the following lines:

    renderscript.target=18
    renderscript.support.mode=true
    sdk.buildtools=18.1.0


That’s it! With the RenderScript Support Library, you can continue to use the same APIs from your app as with the native RenderScript package (with a few minor exceptions that we’ll talk about below), and you can use the same features in your own scripts as you would with the latest RenderScript toolchain.

For complete details on how to set up the RenderScript Support Library, see Accessing RenderScript Java APIs.


API and Implementation details


If you'd like to use RenderScript Support Library in your app, there are few things you should know:


  • First, the RenderScript Support Library supports almost all of the RenderScript API functions as the native API that's available in API level and higher. The one notable exception is that Allocation.USAGE_IO_INPUT and Allocation.USAGE_IO_OUTPUT are not currently available in the RenderScript Support Library.


  • Second, devices running Android 4.2 and earlier will always run their RenderScript applications on the CPU, while devices running Android 4.3 or later will run their RenderScript applications on whatever processors are available on that particular device. Because the Support Library versions of the scripts have to be precompiled to support all possible platforms, there is a performance hit when running the precompiled scripts compared to runtime compilation on Android 4.3 due to more restrictions on compiler optimizations.


We’re really pleased with how the RenderScript Support Library has turned out. We've already seen how it performs in a shipping app — it's been part of the photo editor in the Google+ Android app since May 2013, and it’s definitely proven itself in a large and widely used application. We hope you’ll be happy with it too.


Thursday, 29 August 2013

RenderScript Intrinsics


Posted by R. Jason Sams, Android RenderScript Tech Lead


RenderScript has a very powerful ability called Intrinsics. Intrinsics are built-in functions that perform well-defined operations often seen in image processing. Intrinsics can be very helpful to you because they provide extremely high-performance implementations of standard functions with a minimal amount of code.


RenderScript intrinsics will usually be the fastest possible way for a developer to perform these operations. We’ve worked closely with our partners to ensure that the intrinsics perform as fast as possible on their architectures — often far beyond anything that can be achieved in a general-purpose language.


Table 1. RenderScript intrinsics and the operations they provide.


NameOperation
ScriptIntrinsicConvolve3x3, ScriptIntrinsicConvolve5x5Performs a 3x3 or 5x5 convolution.
ScriptIntrinsicBlurPerforms a Gaussian blur. Supports grayscale and RGBA buffers and is used by the system framework for drop shadows.
ScriptIntrinsicYuvToRGBConverts a YUV buffer to RGB. Often used to process camera data.
ScriptIntrinsicColorMatrixApplies a 4x4 color matrix to a buffer.
ScriptIntrinsicBlendBlends two allocations in a variety of ways.
ScriptIntrinsicLUTApplies a per-channel lookup table to a buffer.
ScriptIntrinsic3DLUTApplies a color cube with interpolation to a buffer.


Your application can use one of these intrinsics with very little code. For example, to perform a Gaussian blur, the application can do the following:


RenderScript rs = RenderScript.create(theActivity);
ScriptIntrinsicBlur theIntrinsic = ScriptIntrinsicBlur.create(mRS, Element.U8_4(rs));;
Allocation tmpIn = Allocation.createFromBitmap(rs, inputBitmap);
Allocation tmpOut = Allocation.createFromBitmap(rs, outputBitmap);
theIntrinsic.setRadius(25.f);
theIntrinsic.setInput(tmpIn);
theIntrinsic.forEach(tmpOut);
tmpOut.copyTo(outputBitmap);


This example creates a RenderScript context and a Blur intrinsic. It then uses the intrinsic to perform a Gaussian blur with a 25-pixel radius on the allocation. The default implementation of blur uses carefully hand-tuned assembly code, but on some hardware it will instead use hand-tuned GPU code.


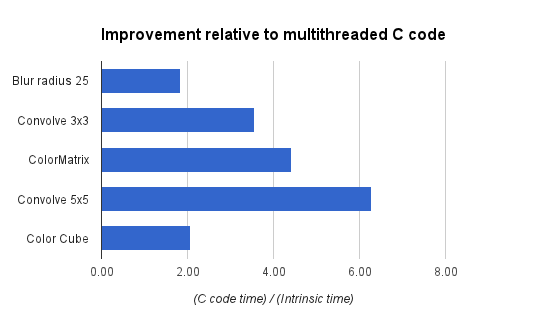
What do developers get from the tuning that we’ve done? On the new Nexus 7, running that same 25-pixel radius Gaussian blur on a 1.6 megapixel image takes about 176ms. A simpler intrinsic like the color matrix operation takes under 4ms. The intrinsics are typically 2-3x faster than a multithreaded C implementation and often 10x+ faster than a Java implementation. Pretty good for eight lines of code.


Renderscript optimizations chartstyle="border:1px solid #ddd;border-radius: 6px;" />

Figure 1. Performance gains with RenderScript intrinsics, relative to equivalent multithreaded C implementations.


Applications that need additional functionality can mix these intrinsics with their own RenderScript kernels. An example of this would be an application that is taking camera preview data, converting it from YUV to RGB, adding a vignette effect, and uploading the final image to a SurfaceView for display.


In this example, we’ve got a stream of data flowing between a source device (the camera) and an output device (the display) with a number of possible processors along the way. Today, these operations can all run on the CPU, but as architectures become more advanced, using other processors becomes possible.


For example, the vignette operation can happen on a compute-capable GPU (like the ARM Mali T604 in the Nexus 10), while the YUV to RGB conversion could happen directly on the camera’s image signal processor (ISP). Using these different processors could significantly improve power consumption and performance. As more these processors become available, future Android updates will enable RenderScript to run on these processors, and applications written for RenderScript today will begin to make use of those processors transparently, without any additional work for developers.


Intrinsics provide developers a powerful tool they can leverage with minimal effort to achieve great performance across a wide variety of hardware. They can be mixed and matched with general purpose developer code allowing great flexibility in application design. So next time you have performance issues with image manipulation, I hope you give them a look to see if they can help.


Followers