Wednesday, 30 March 2011

Identifying App Installations

[The contents of this post grew out of an internal discussion featuring many of the usual suspects who’ve been authors in this space. — Tim Bray]

In the Android group, from time to time we hear complaints from developers about problems they’re having coming up with reliable, stable, unique device identifiers. This worries us, because we think that tracking such identifiers isn’t a good idea, and that there are better ways to achieve developers’ goals.

Tracking Installations


It is very common, and perfectly reasonable, for a developer to want to track individual installations of their apps. It sounds plausible just to call TelephonyManager.getDeviceId() and use that value to identify the installation. There are problems with this
: First, it doesn’t work reliably (see below). Second, when it does work, that value survives device wipes (“Factory resets”) and thus you could end up making a nasty mistake when one of your customers wipes their device and passes it on to another person.

To track installations, you could for example use a UUID as an identifier, and simply create a new one the first time an app runs after installation. Here is a sketch of a class named “Installation” with one static method Installation.id(Context context). You could imagine writing more installation-specific data into the INSTALLATION file.

public class Installation {
private static String sID = null;
private static final String INSTALLATION = "INSTALLATION";

public synchronized static String id(Context context) {
if (sID == null) {
File installation = new File(context.getFilesDir(), INSTALLATION);
try {
if (!installation.exists())
writeInstallationFile(installation);
sID = readInstallationFile(installation);
} catch (Exception e) {
throw new RuntimeException(e);
}
}
return sID;
}

private static String readInstallationFile(File installation) throws IOException {
RandomAccessFile f = new RandomAccessFile(installation, "r");
byte[] bytes = new byte[(int) f.length()];
f.readFully(bytes);
f.close();
return new String(bytes);
}

private static void writeInstallationFile(File installation) throws IOException {
FileOutputStream out = new FileOutputStream(installation);
String id = UUID.randomUUID().toString();
out.write(id.getBytes());
out.close();
}
}

Identifying Devices

Suppose you feel that for the needs of your application, you need an actual hardware device identifier. This turns out to be a tricky problem.

In the past, when every Android device was a phone, things were simpler: TelephonyManager.getDeviceId() is required to return (depending on the network technology) the IMEI, MEID, or ESN of the phone, which is unique to that piece of hardware.

However, there are problems with this approach:

  • Non-phones: Wifi-only devices or music players that don’t have telephony hardware just don’t have this kind of unique identifier.


  • Persistence: On devices which do have this, it persists across device data wipes and factory resets. It’s not clear at all if, in this situation, your app should regard this as the same device.


  • Privilege:It requires READ_PHONE_STATE permission, which is irritating if you don’t otherwise use or need telephony.


  • Bugs: We have seen a few instances of production phones for which the implementation is buggy and returns garbage, for example zeros or asterisks.


Mac Address

It may be possible to retrieve a Mac address from a device’s WiFi or Bluetooth hardware. We do not recommend using this as a unique identifier. To start with, not all devices have WiFi. Also, if the WiFi is not turned on, the hardware may not report the Mac address.

Serial Number

Since Android 2.3 (“Gingerbread”) this is available via android.os.Build.SERIAL. Devices without telephony are required to report a unique device ID here; some phones may do so also.

ANDROID_ID

More specifically, Settings.Secure.ANDROID_ID. This is a 64-bit quantity that is generated and stored when the device first boots. It is reset when the device is wiped.

ANDROID_ID seems a good choice for a unique device identifier. There are downsides: First, it is not 100% reliable on releases of Android prior to 2.2 (“Froyo”). Also, there has been at least one widely-observed bug in a popular handset from a major manufacturer, where every instance has the same ANDROID_ID.

Conclusion

For the vast majority of applications, the requirement is to identify a particular installation, not a physical device. Fortunately, doing so is straightforward.

There are many good reasons for avoiding the attempt to identify a particular device. For those who want to try, the best approach is probably the use of ANDROID_ID on anything reasonably modern, with some fallback heuristics for legacy devices.

Tuesday, 29 March 2011

In-app Billing Launched on Android Market

[This post is by Eric Chu, Android Developer Ecosystem. —Dirk Dougherty]

Today, we're pleased to announce the launch of Android Market In-app Billing to developers and users. As an Android developer, you will now be able to publish apps that use In-app Billing and your users can make purchases from within your apps.

In-app Billing gives you more ways to monetize your apps with try-and-buy, virtual goods, upgrades, and other billing models. If you aren’t yet familiar with In-app Billing, we encourage you to learn more about it.

Several apps launching today are already using the service, including Tap Tap Revenge by Disney Mobile; Comics by ComiXology; Gun Bros, Deer Hunter Challenge HD, and WSOP3 by Glu Mobile; and Dungeon Defenders: FW Deluxe by Trendy Entertainment.

To try In-app Billing in your apps, start with the detailed documentation and complete sample app provided, which show how to implement the service in your app, set up in-app product lists in Android Market, and test your implementation. Also, it’s absolutely essential that you review the security guidelines to make sure your billing implementation is secure.

We look forward to seeing how you’ll use this new service in your apps!

Thursday, 24 March 2011

In-App Billing on Android Market: Ready for Testing

[This post is by Eric Chu, Android Developer Ecosystem. —Dirk Dougherty]

Back in January we announced our plan to introduce Android Market In-app Billing this quarter. We're pleased to let you know that we will be launching In-app Billing next week.

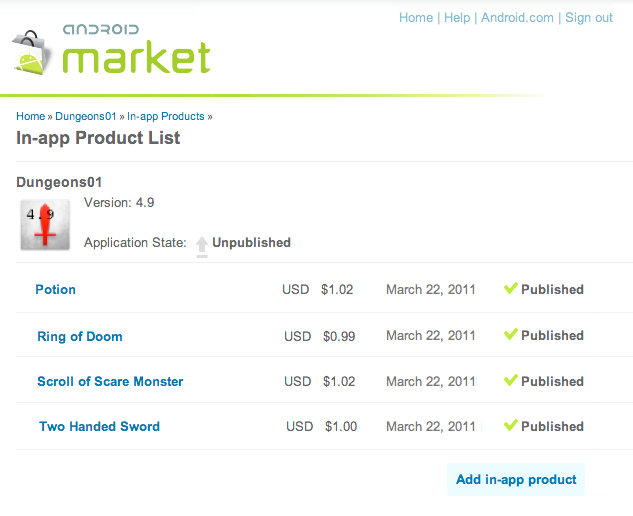
In preparation for the launch, we are opening up Android Market for upload and end-to-end testing of your apps that use In-app Billing. You can now upload your apps to the Developer Console, create a catalog of in-app products, and set prices for them. You can then set up accounts to test in-app purchases. During these test transactions, the In-app Billing service interacts with your app exactly as it will for actual users and live transactions.

Note that although you can upload apps during this test development phase, you won’t be able to actually publish the apps to users until the full launch of the service next week.


To get you started, we’ve updated the developer documentation with information about how to set up product lists and test your in-app products. Also, it is absolutely essential that you review the security guidelines to make sure your billing implementation is secure.

We encourage you start uploading and testing your apps right away.

Memory Analysis for Android Applications

[This post is by Patrick Dubroy, an Android engineer who writes about programming, usability, and interaction on his personal blog. — Tim Bray]

The Dalvik runtime may be garbage-collected, but that doesn't mean you can ignore memory management. You should be especially mindful of memory usage on mobile devices, where memory is more constrained. In this article, we're going to take a look at some of the memory profiling tools in the Android SDK that can help you trim your application's memory usage.

Some memory usage problems are obvious. For example, if your app leaks memory every time the user touches the screen, it will probably trigger an OutOfMemoryError eventually and crash your app. Other problems are more subtle, and may just degrade the performance of both your app (as garbage collections are more frequent and take longer) and the entire system.

Tools of the trade

The Android SDK provides two main ways of profiling the memory usage of an app: the Allocation Tracker tab in DDMS, and heap dumps. The Allocation Tracker is useful when you want to get a sense of what kinds of allocation are happening over a given time period, but it doesn't give you any information about the overall state of your application's heap. For more information about the Allocation Tracker, see the article on Tracking Memory Allocations. The rest of this article will focus on heap dumps, which are a more powerful memory analysis tool.

A heap dump is a snapshot of an application's heap, which is stored in a binary format called HPROF. Dalvik uses a format that is similar, but not identical, to the HPROF tool in Java. There are a few ways to generate a heap dump of a running Android app. One way is to use the Dump HPROF file button in DDMS. If you need to be more precise about when the dump is created, you can also create a heap dump programmatically by using the android.os.Debug.dumpHprofData() function.

To analyze a heap dump, you can use a standard tool like jhat or the Eclipse Memory Analyzer (MAT). However, first you'll need to convert the .hprof file from the Dalvik format to the J2SE HPROF format. You can do this using the hprof-conv tool provided in the Android SDK. For example:

hprof-conv dump.hprof converted-dump.hprof

Example: Debugging a memory leak

In the Dalvik runtime, the programmer doesn't explicitly allocate and free memory, so you can't really leak memory like you can in languages like C and C++. A "memory leak" in your code is when you keep a reference to an object that is no longer needed. Sometimes a single reference can prevent a large set of objects from being garbage collected.

Let's walk through an example using the Honeycomb Gallery sample app from the Android SDK. It's a simple photo gallery application that demonstrates how to use some of the new Honeycomb APIs. (To build and download the sample code, see the instructions.) We're going to deliberately add a memory leak to this app in order to demonstrate how it could be debugged.

Imagine that we want to modify this app to pull images from the network. In order to make it more responsive, we might decide to implement a cache which holds recently-viewed images. We can do that by making a few small changes to ContentFragment.java. At the top of the class, let's add a new static variable:

private static HashMap<String,Bitmap> sBitmapCache = new HashMap<String,Bitmap>();

This is where we'll cache the Bitmaps that we load. Now we can change the updateContentAndRecycleBitmap() method to check the cache before loading, and to add Bitmaps to the cache after they're loaded.

void updateContentAndRecycleBitmap(int category, int position) {
if (mCurrentActionMode != null) {
mCurrentActionMode.finish();
}

// Get the bitmap that needs to be drawn and update the ImageView.

// Check if the Bitmap is already in the cache
String bitmapId = "" + category + "." + position;
mBitmap = sBitmapCache.get(bitmapId);

if (mBitmap == null) {
// It's not in the cache, so load the Bitmap and add it to the cache.
// DANGER! We add items to this cache without ever removing any.
mBitmap = Directory.getCategory(category).getEntry(position)
.getBitmap(getResources());
sBitmapCache.put(bitmapId, mBitmap);
}
((ImageView) getView().findViewById(R.id.image)).setImageBitmap(mBitmap);
}

I've deliberately introduced a memory leak here: we add Bitmaps to the cache without ever removing them. In a real app, we'd probably want to limit the size of the cache in some way.

Examining heap usage in DDMS

The Dalvik Debug Monitor Server (DDMS) is one of the primary Android debugging tools. DDMS is part of the ADT Eclipse plug-in, and a standalone version can also be found in the tools/ directory of the Android SDK. For more information on DDMS, see Using DDMS.

Let's use DDMS to examine the heap usage of this app. You can start up DDMS in one of two ways:

  • from Eclipse: click Window > Open Perspective > Other... > DDMS
  • or from the command line: run ddms (or ./ddms on Mac/Linux) in the tools/ directory

Select the process com.example.android.hcgallery in the left pane, and then click the Show heap updates button in the toolbar. Then, switch to the VM Heap tab in DDMS. It shows some basic stats about our heap memory usage, updated after every GC. To see the first update, click the Cause GC button.

We can see that our live set (the Allocated column) is a little over 8MB. Now flip through the photos, and watch that number go up. Since there are only 13 photos in this app, the amount of memory we leak is bounded. In some ways, this is the worst kind of leak to have, because we never get an OutOfMemoryError indicating that we are leaking.

Creating a heap dump

Let's use a heap dump to track down the problem. Click the Dump HPROF file button in the DDMS toolbar, choose where you want to save the file, and then run hprof-conv on it. In this example, I'll be using the standalone version of MAT (version 1.0.1), available from the MAT download site.

If you're running ADT (which includes a plug-in version of DDMS) and have MAT installed in Eclipse as well, clicking the “dump HPROF” button will automatically do the conversion (using hprof-conv) and open the converted hprof file into Eclipse (which will be opened by MAT).

Analyzing heap dumps using MAT

Start up MAT and load the converted HPROF file we just created. MAT is a powerful tool, and it's beyond the scope of this article to explain all it's features, so I'm just going to show you one way you can use it to detect a leak: the Histogram view. The Histogram view shows a list of classes sortable by the number of instances, the shallow heap (total amount of memory used by all instances), or the retained heap (total amount of memory kept alive by all instances, including other objects that they have references to).

If we sort by shallow heap, we can see that instances of byte[] are at the top. As of Android 3.0 (Honeycomb), the pixel data for Bitmap objects is stored in byte arrays (previously it was not stored in the Dalvik heap), and based on the size of these objects, it's a safe bet that they are the backing memory for our leaked bitmaps.

Right-click on the byte[] class and select List Objects > with incoming references. This produces a list of all byte arrays in the heap, which we can sort based on Shallow Heap usage.

Pick one of the big objects, and drill down on it. This will show you the path from the root set to the object -- the chain of references that keeps this object alive. Lo and behold, there's our bitmap cache!

MAT can't tell us for sure that this is a leak, because it doesn't know whether these objects are needed or not -- only the programmer can do that. In this case, the cache is using a large amount of memory relative to the rest of the application, so we might consider limiting the size of the cache.

Comparing heap dumps with MAT

When debugging memory leaks, sometimes it's useful to compare the heap state at two different points in time. To do this, you'll need to create two separate HPROF files (don't forget to convert them using hprof-conv).

Here's how you can compare two heap dumps in MAT (it's a little complicated):

  1. Open the first HPROF file (using File > Open Heap Dump).
  2. Open the Histogram view.
  3. In the Navigation History view (use Window > Navigation History if it's not visible), right click on histogram and select Add to Compare Basket.
  4. Open the second HPROF file and repeat steps 2 and 3.
  5. Switch to the Compare Basket view, and click Compare the Results (the red "!" icon in the top right corner of the view).

Conclusion

In this article, I've shown how the Allocation Tracker and heap dumps can give you get a better sense of your application's memory usage. I also showed how The Eclipse Memory Analyzer (MAT) can help you track down memory leaks in your app. MAT is a powerful tool, and I've only scratched the surface of what you can do with it. If you'd like to learn more, I recommend reading some of these articles:

Followers